Attendee Statistics & Demographics
New to ASHG? Curious who you’ll see at our meeting? Check out the statistics and demographics below about the world’s largest human genetics and genomics meeting.
| San Diego, CA | Orlando, Florida | Vancouver, Canada | Baltimore, MD | San Diego, CA | |
| REGISTRATION | 2018 | 2017 | 2016 | 2015 | 2014 |
| Members | 3325 | 2424 | 2592 | 2413 | 2700 |
| Trainee Member | 1672 | 1276 | 1360 | 1379 | 1502 |
| Emeritus Member | 28 | 19 | 22 | 33 | 31 |
| Nonmembers | 980 | 1187 | 1286 | 1241 | 1231 |
| Trainee Nonmembers | 191 | 268 | 313 | 281 | 332 |
| Trainee Single Day | 132 | 46 | 91 | 119 | 55 |
| Developing Country | 67 | 27 | 49 | 52 | 27 |
| Exhibitor Scientific Attendees | 343 | 297 | 342 | 278 | 329 |
| TOTAL SCIENTIFIC | 7049 | 5918 | 6373 | 6152 | 6495 |
| TOTAL EXHIBIT PERSONNEL | 1591 | 1353 | 1424 | 1624 | 1867 |
| GRAND TOTAL | 9020 | 7459 | 7998 | 7776 | 8362 |
| ABSTRACTS/INVITED SESSIONS | |||||
| Abstracts Submitted | 3687 | 3147 | 3484 | 3193 | 3508 |
| Abstracts to Platform | 360 | 360 | 315 | 384 | 400 |
| Abstracts to Plenary | 12 | 12 | 12 | 6 | 6 |
| Abstracts to Posters | 3315 | 2775 | 3070 | 2803 | 3102 |
| Invited Proposals Received | 62 | 59 | 63 | 73 | 86 |
| Invited Proposals Programmed | 17 | 17 | 17 | 20 | 16 |
| EXHIBIT HALL | |||||
| Total # of Booths Sold | 361 | 334 | 354 | 363 | 344 |
| Total # of Companies | 256 | 236 | 242 | 243 | 243 |
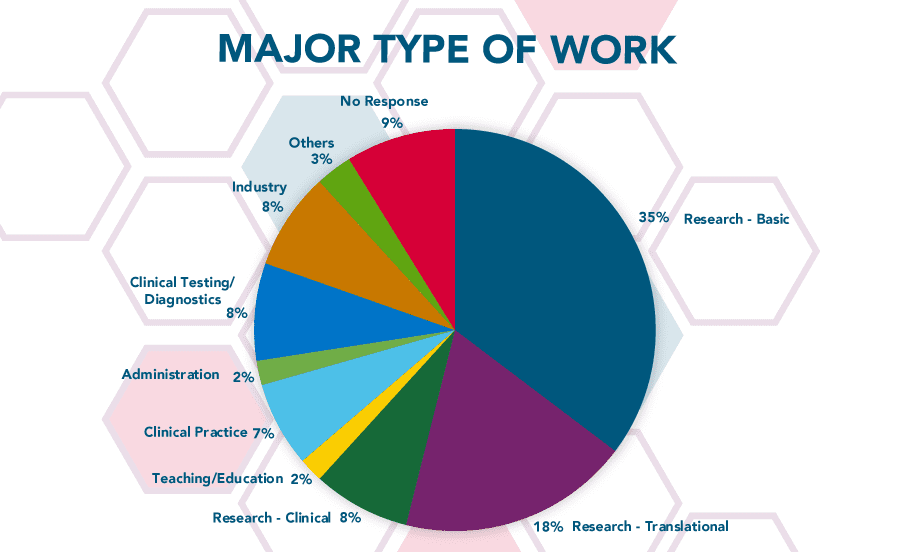
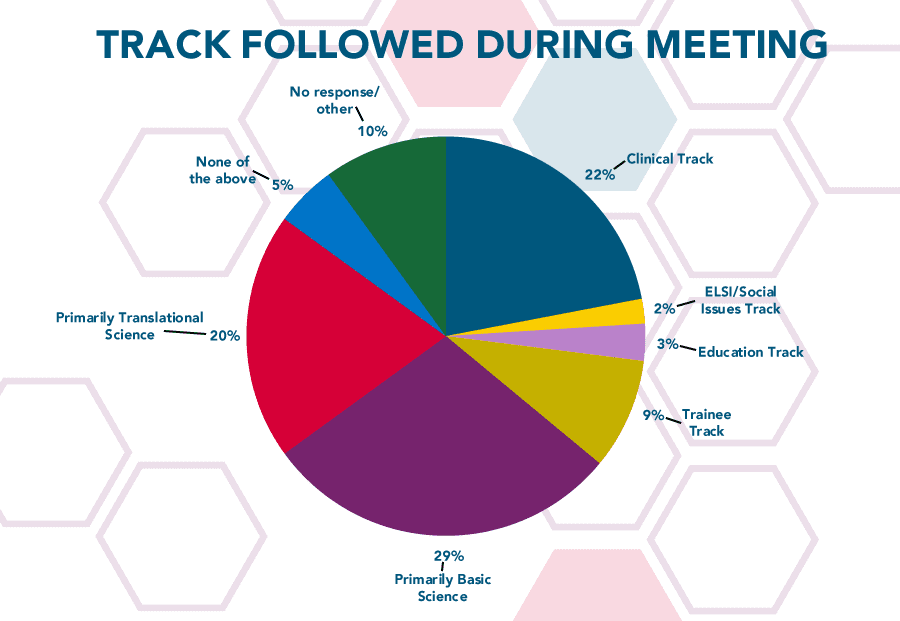
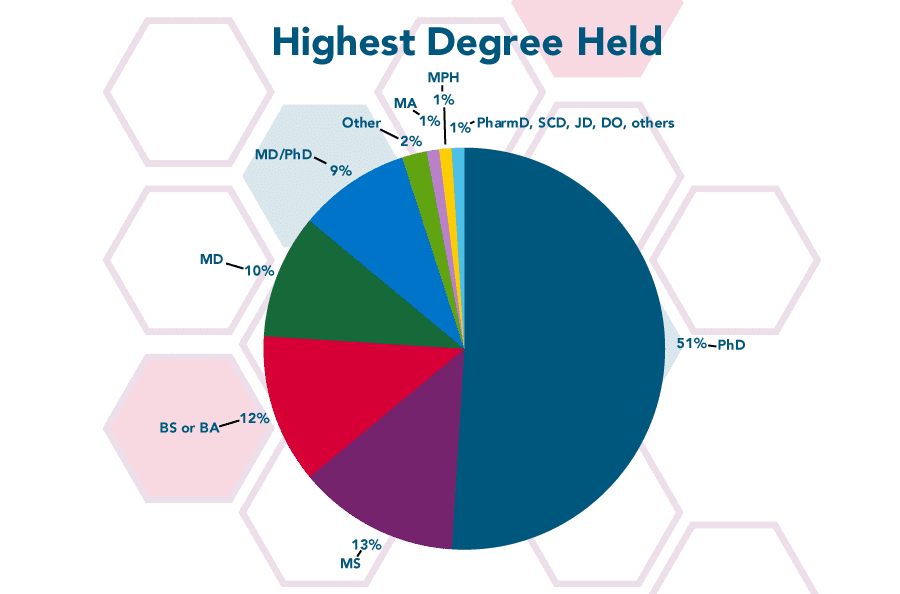
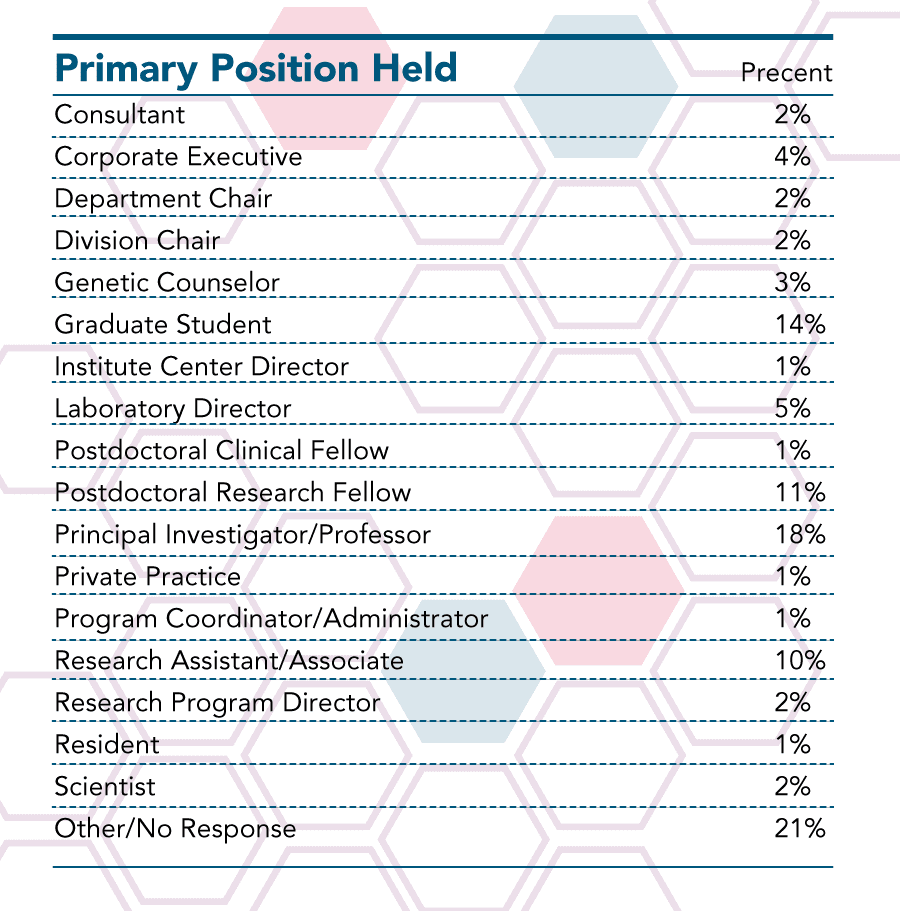
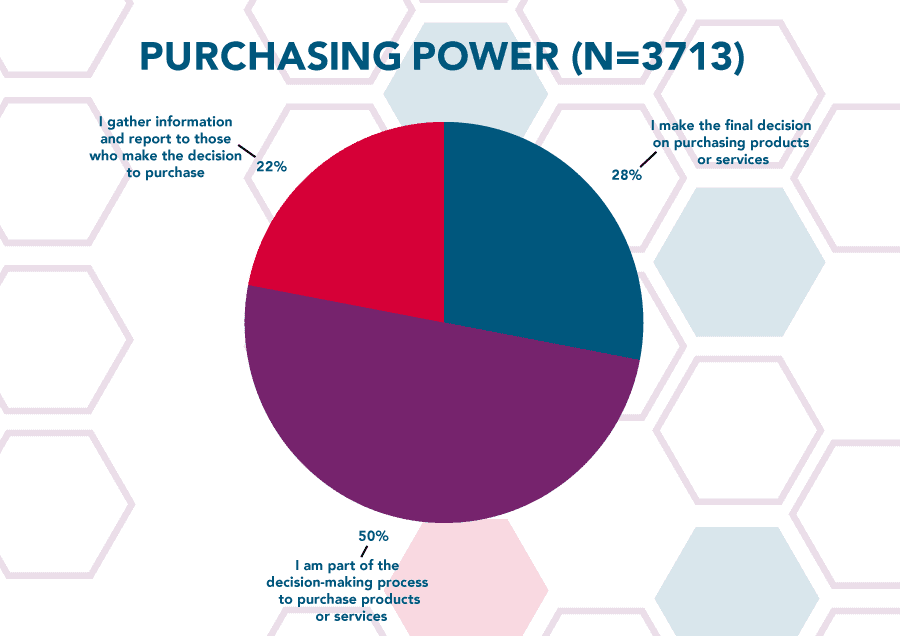
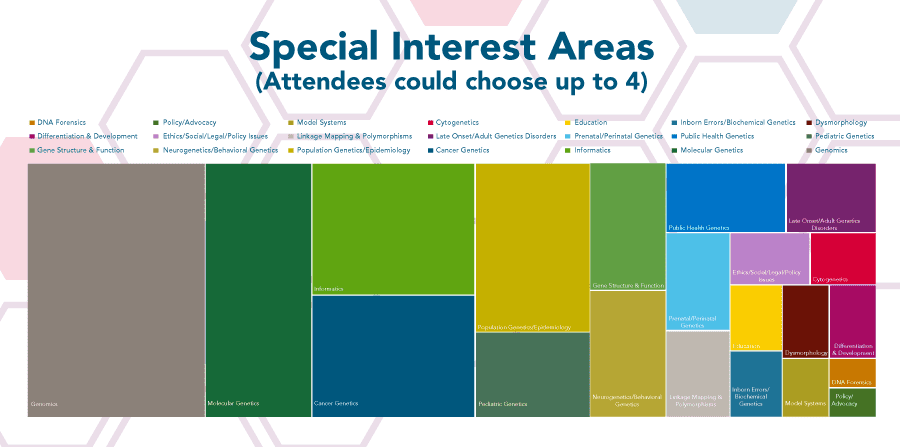
2018 Attendee Demographics
